Lessons from Black Monday
What 1987 Can Teach Us About Market Selloffs
How mechanical selling can amplify a decline, why liquidity matters, and why the first rebound does not always mark the end of market stress.
Read full reportResearch library
Independent research on energy, the environment, macro conditions, and financial markets. Browse all reports or filter by topic below.
All reports · 26 reports
Lessons from Black Monday
How mechanical selling can amplify a decline, why liquidity matters, and why the first rebound does not always mark the end of market stress.
Read full report
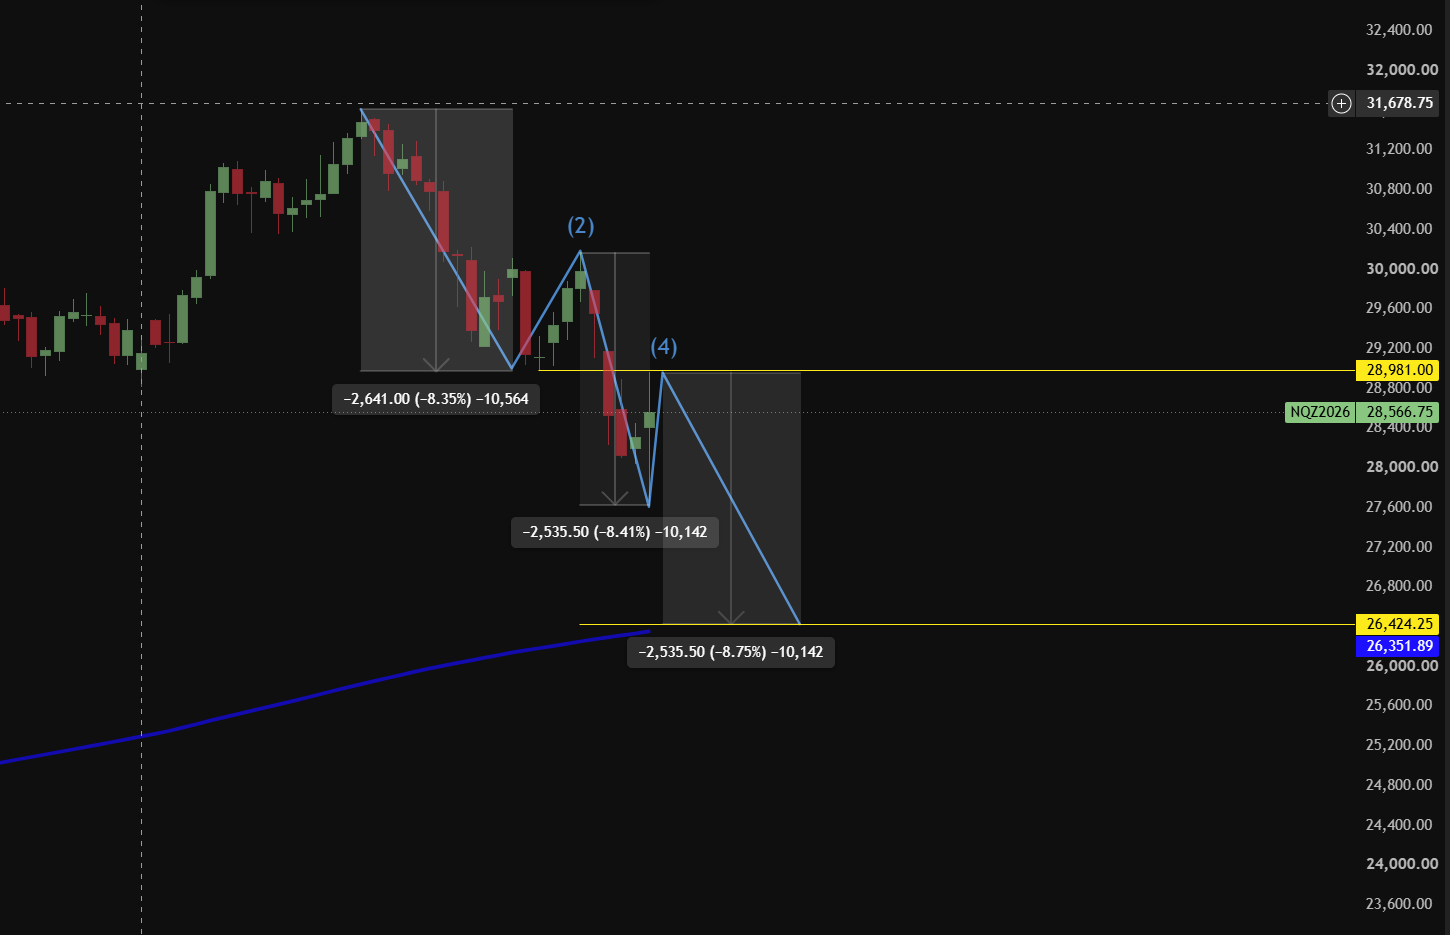
NQ × Wave 5 Watch × ABC RecoveryUpdated five-wave roadmap
We favor a fifth leg toward 26,424, with MA365 near 26,352 a separate support test. A new high above the November 4 intraday peak invalidates the immediate count.
Read full report
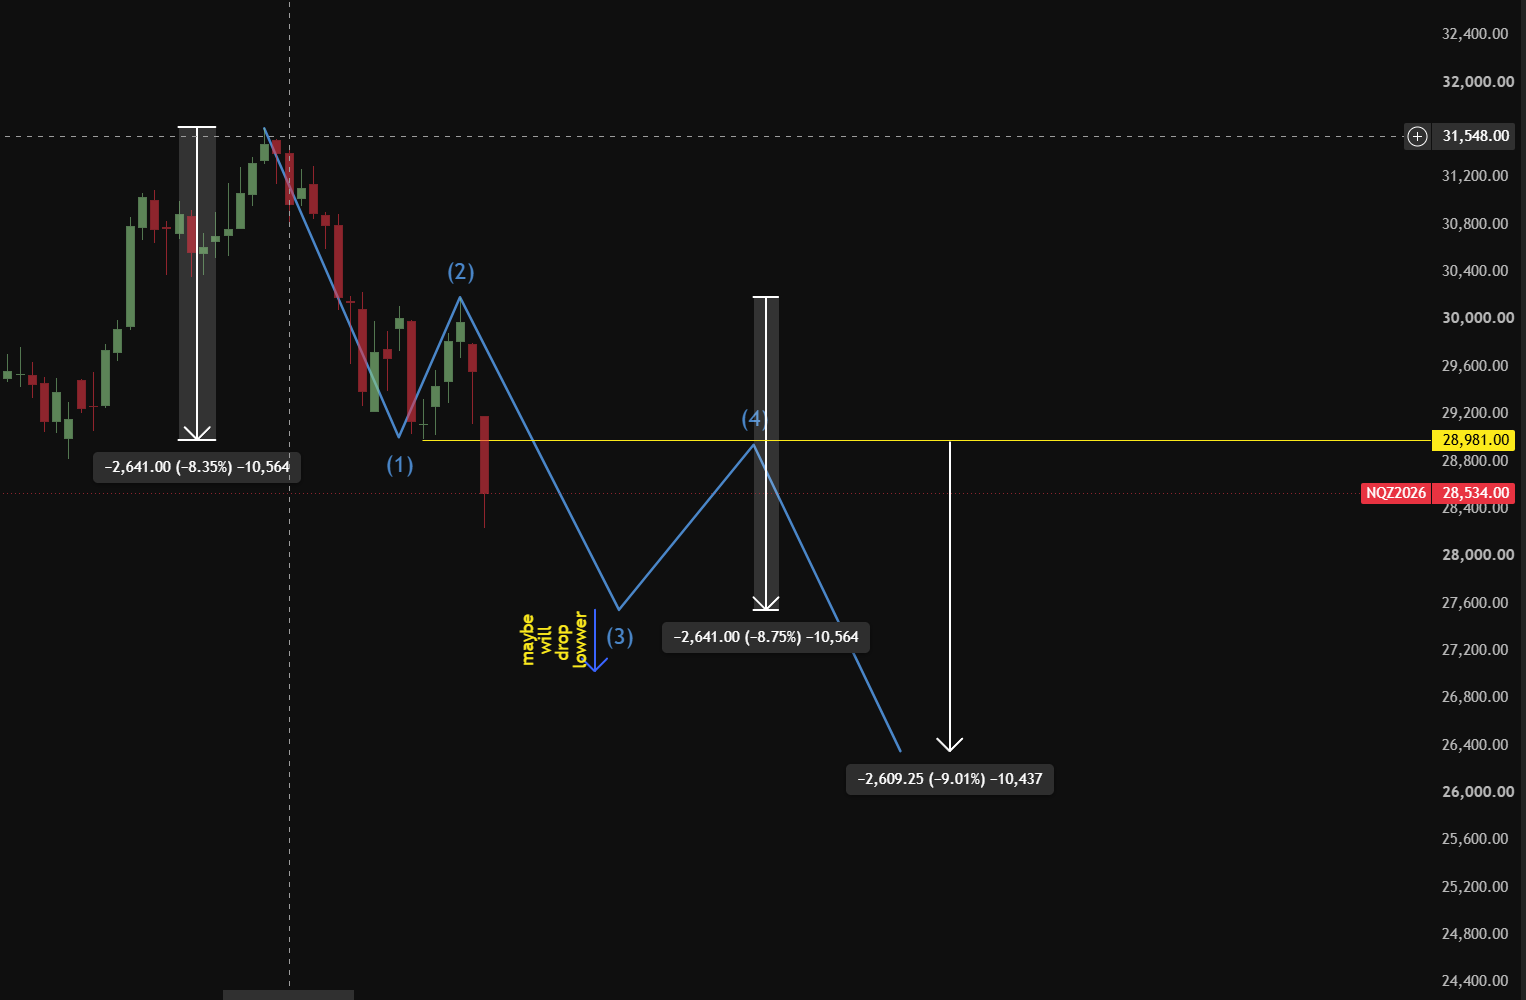
NQ × Five-Wave Structure × Wave 3 ExtensionFive-wave technical roadmap
Our preferred measured-leg scenario leaves roughly 700 points or more of downside. Waves 4 and 5 remain projections, with a custom fourth-wave closing ceiling near 28,970.
Read full reportTechnical and earnings outlook
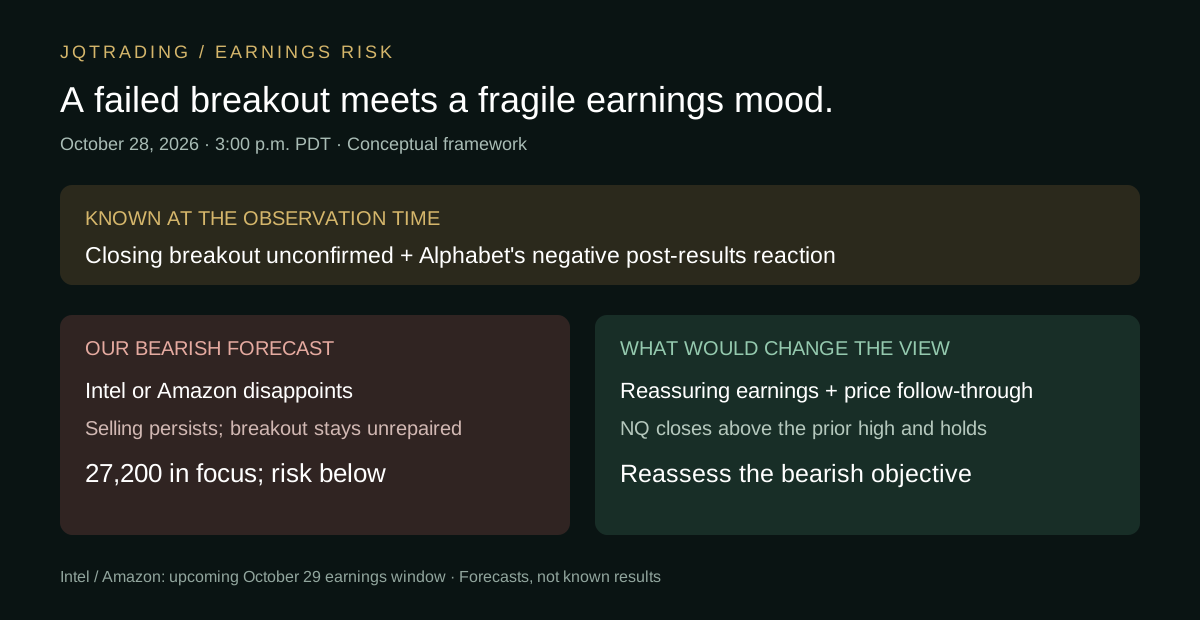
Alphabet's disappointing earnings reaction reinforces our bearish bias. We expect the Intel and Amazon earnings window to test sentiment, while a constructive surprise could invalidate the call.
Read full reportShort technical update
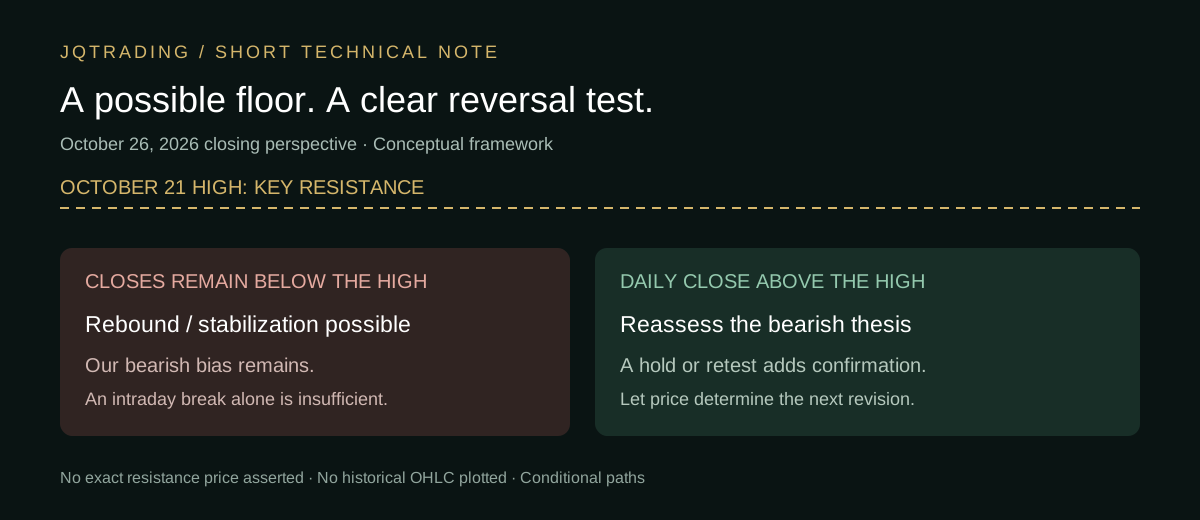
The daily candle leaves room for a rebound or stabilization. We stay bearish while daily closes remain below the October 21 high.
Read full reportTechnical and news analysis
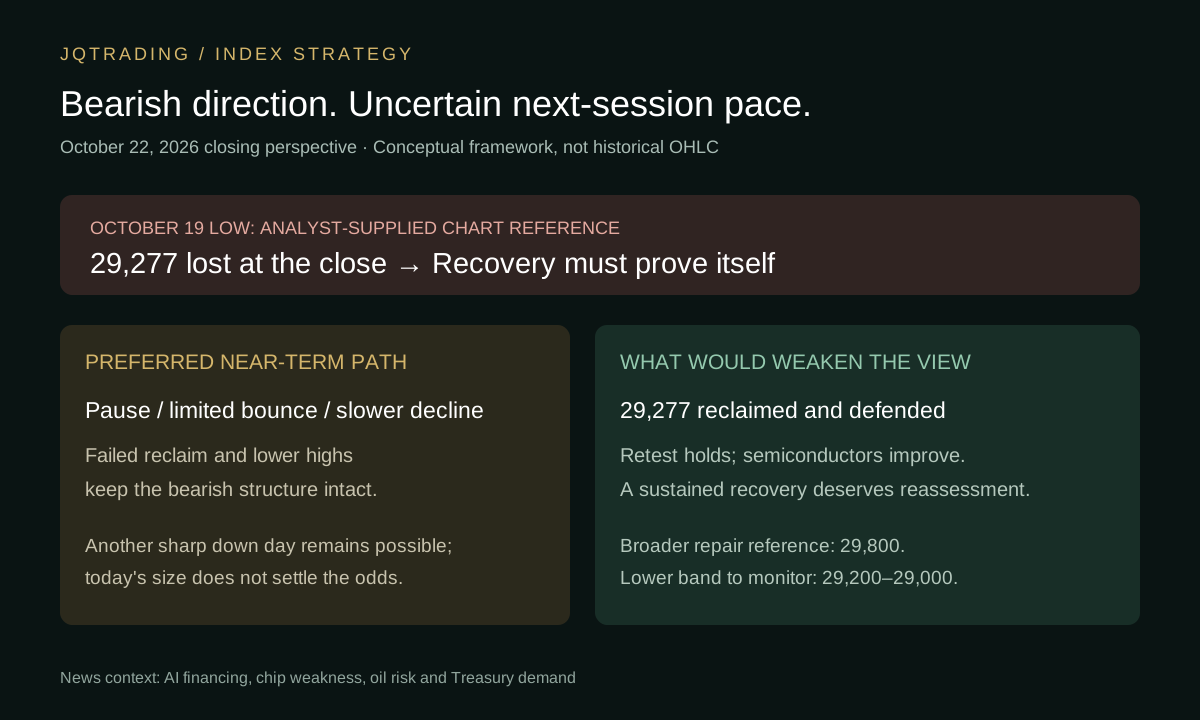
A support failure and pressure on AI leadership favor downside. After a large down session, we allow for a pause or limited bounce before a slower decline.
Read full reportRevisiting our bearish view
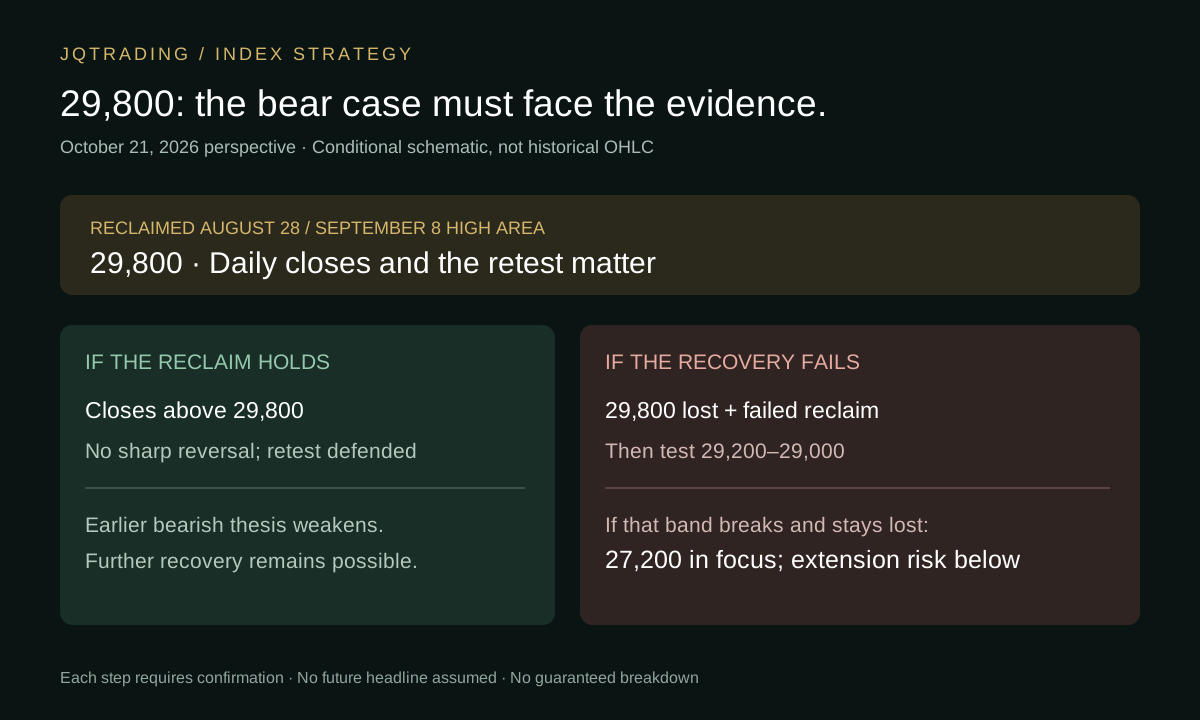
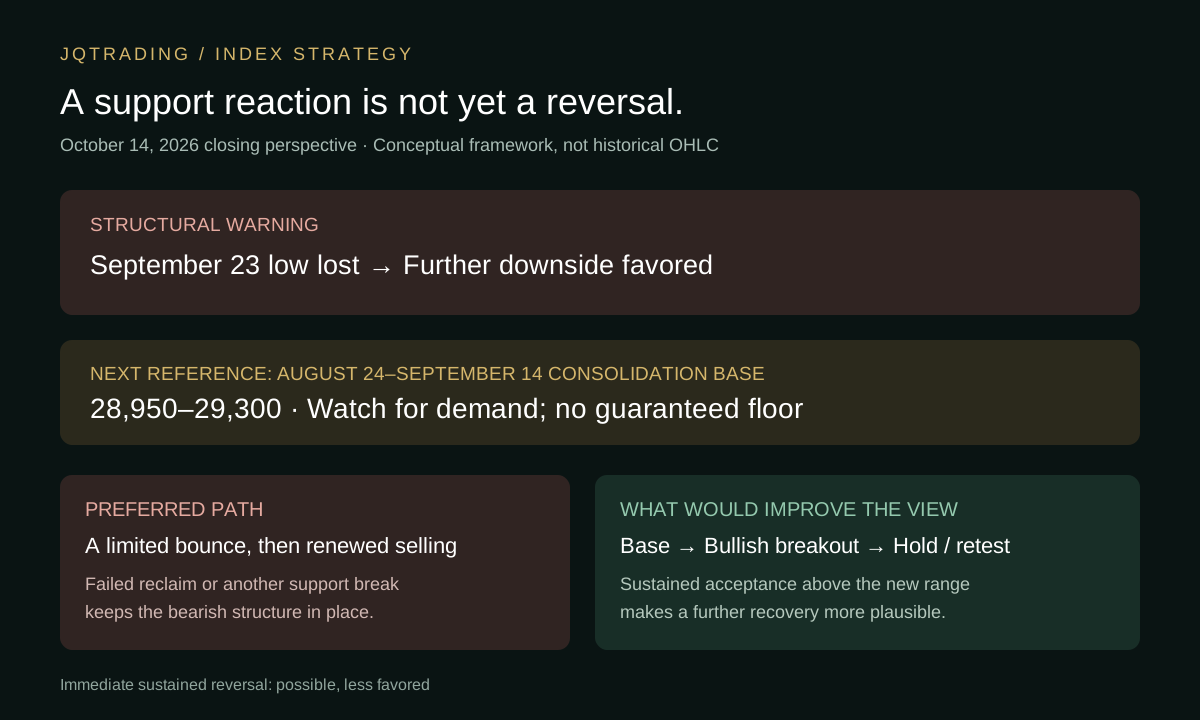
Holding 29,800 challenges the October 14 call. A failed recovery and a sustained break below 29,200–29,000 would reopen risk toward 27,200 and potentially below.
Read full reportTechnical follow-up
Early bearish structure points toward 28,950–29,300. We expect potential buying at the old consolidation base, but favor a rebound that fails unless a new base breaks higher and holds.
Read full reportTechnical outlook
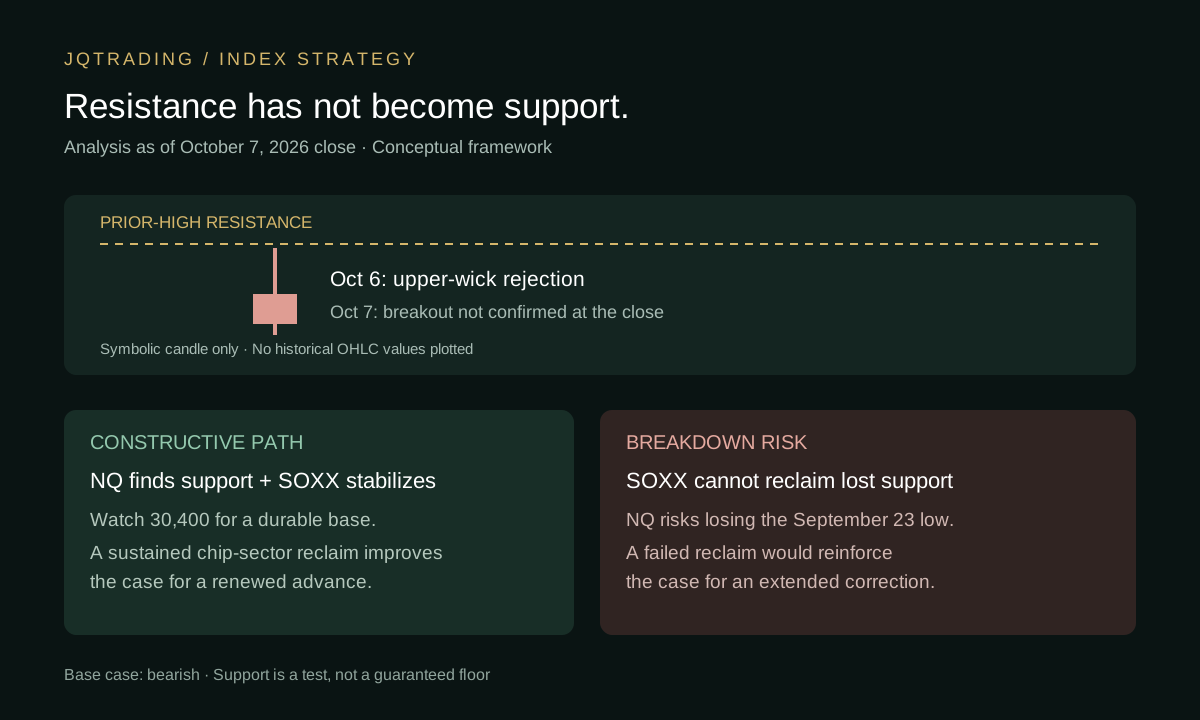
Two sessions without breakout confirmation favor a correction toward the September 23 low. We watch 30,400 and semiconductor stabilization for a possible recovery.
Read full report
AI × Capital Cycles × ValuationComplete research edition · 30 exhibits
A complete, illustrated study of AI revenue, capital spending, supply chains, model economics, chips, memory, valuation, employment, and investment scenarios.
Read full report

NQ × YM × Spread ReversalTactical bearish outlook
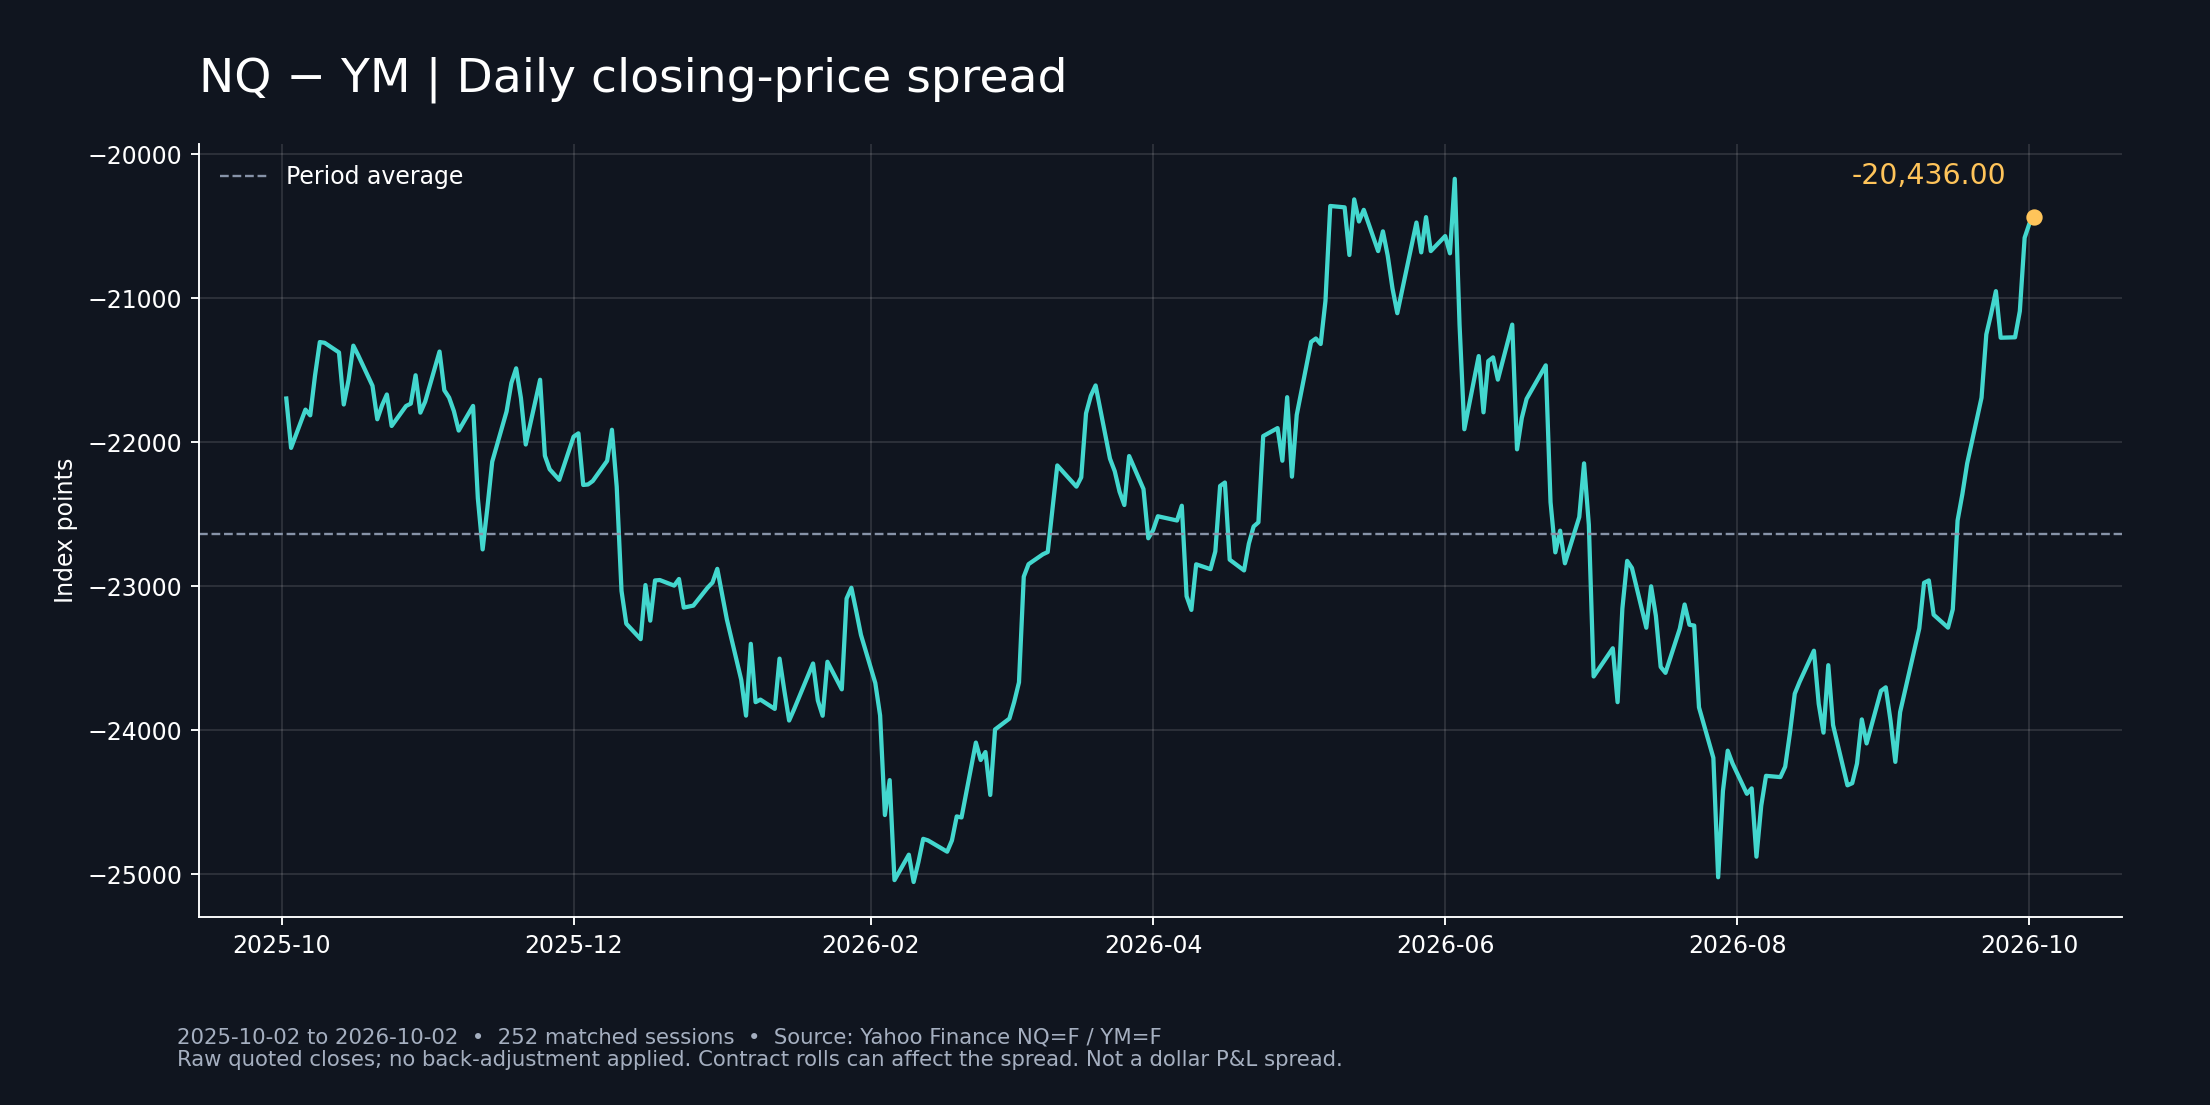
Three historical pullbacks, spread-reversion and confirmed NQ-short scenarios, and a conditional 5%–7% correction range after the post-hike rally.
Read full reportRisk monitor
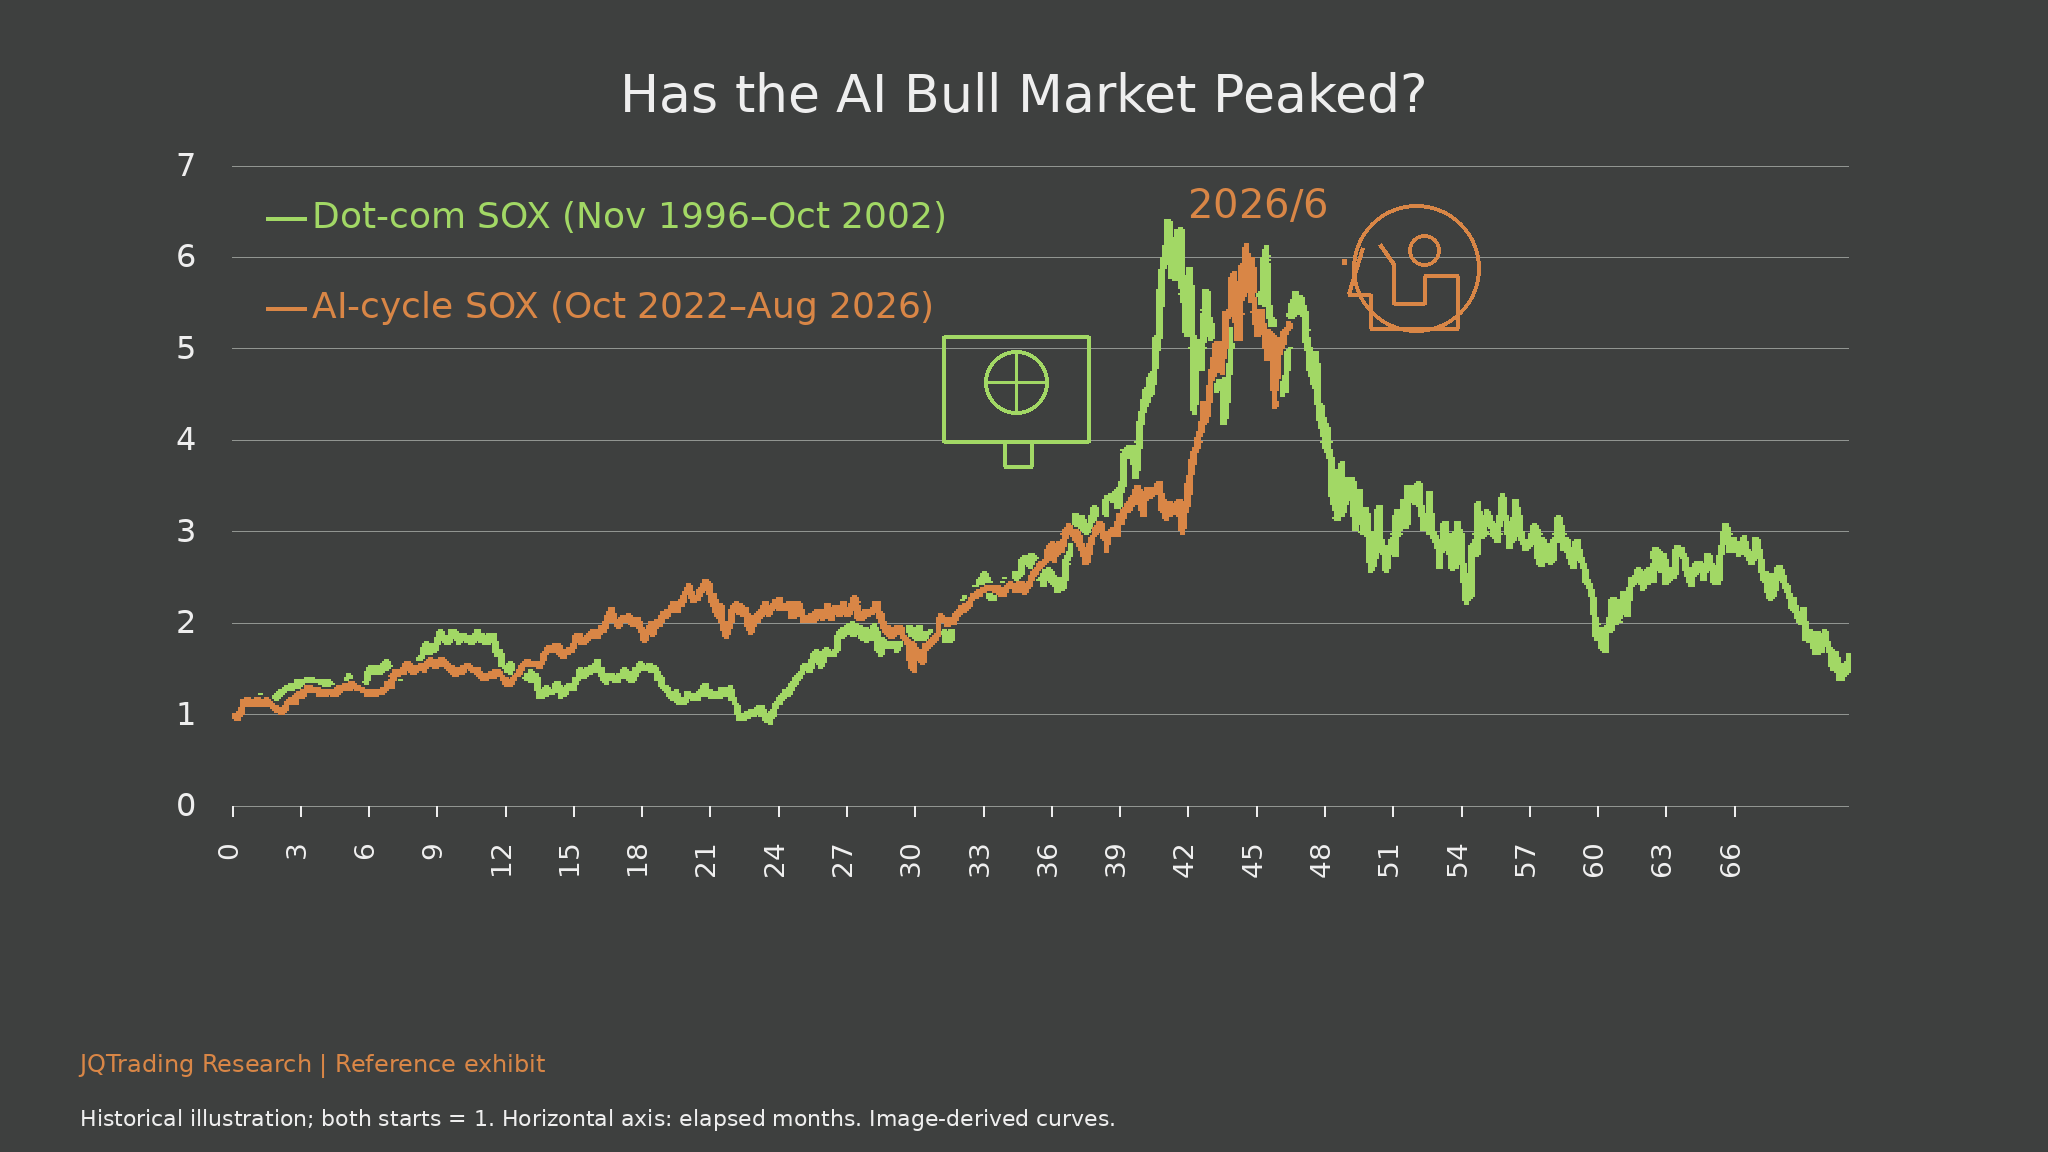
The indexes remain elevated, but Nasdaq new-high breadth, semiconductor and bank leadership, credit spreads, and long-term participation are sending a less confident message.
Read full report
NQ × Record-High Context × Trend CheckResearch follow-up
Why we see the selloff after the Nasdaq's record closes as a potential normal pullback, how the July 30 NQ forecast relates, and what would invalidate our view.
Read full report
El Niño × Crops × FuturesNew research
Why a very strong 2026–2027 El Niño creates the largest upside asymmetry in sugar, vegetable oils, and corn—and how to trade the regional crop calendar without treating every commodity alike.
Read full report
Fed Cycles × S&P 500 × Global CapitalCycle study
What six tightening cycles, three crisis-era cutting cycles, and the U.S.–China performance gap reveal about rates, capital flows, and long-term equity direction.
Read full report
Energy × Inflation × MarketsNew research
How oil, diesel, natural gas, and electricity are moving through consumer prices, Federal Reserve policy, bond yields, equity valuations, and sector leadership.
Read full report
QQQ × Fed Hike × Trend Re-AccelerationPost-hike outlook
Why the completed Fed hike, Nasdaq relative strength, and technology leadership favor a new advance—with 720–723 as the first pivot and a precise post-September 21 risk rule.
Read full report
Climate × Energy × MarketsNew research
How winter heating demand, natural-gas inventories, hydropower shortfalls, and energy inflation could reshape rates, equities, and commodity markets through early 2027.
Read full report
NVDA × Technical Reversal × MacroMarket outlook
Why an inverted-hammer-style rejection at prior resistance, sticky inflation, resilient employment, and stretched AI expectations favor a tactical pullback.
Read full report
INTC × Double Bottom × Semiconductor CycleMarket outlook
Why two defenses of the mid-$85 area, 25% revenue growth, AI-compute demand, improving execution, and 18A manufacturing momentum support a bullish breakout.
Read full report
Crude Oil × Inflation × Fed PolicyMarket outlook
Why choppy Hormuz flows, depleted product inventories, and a global supply deficit point to a staged crude rally from next week—and why $104 should become resistance before a pullback.
Read full report
YM × Trend Continuation × Macro PressureResearch follow-up
Why the low-volume rebound does not end the decline—and how YM can roll over immediately or after a time correction into the week of August 31, with 52,100 still in view.
Read full report
Fed Policy × Inflation × RatesPolicy outlook
Why persistent inflation, an energy-driven price shock, resilient private demand, and a hawkish split inside the FOMC point to a 25-basis-point increase at the September meeting.
Read full report
Bitcoin × Technical Strategy × LiquidityMarket outlook
Why two months of base-building, repeated defense of the August low, and inferred large-buyer absorption point to $77,500 first— and $81,000 if the initial breakout holds.
Read full report
YM1 × Reversal Pattern × RatesMarket outlook
Why the August 5 upper-wick rejection and August 6 bearish expansion candle—reinforced by rising oil, bond yields, and broad constituent weakness—point to a one-month pullback.
Read full report
NQ × Reversal Structure × AI EarningsMarket outlook
Why a June 11-style EMA reclaim, broad semiconductor leadership, cooler core inflation, and earnings-backed AI demand point to a staged recovery toward 30,000.
Read full report