
Executive view
The correction is starting to look more structural.
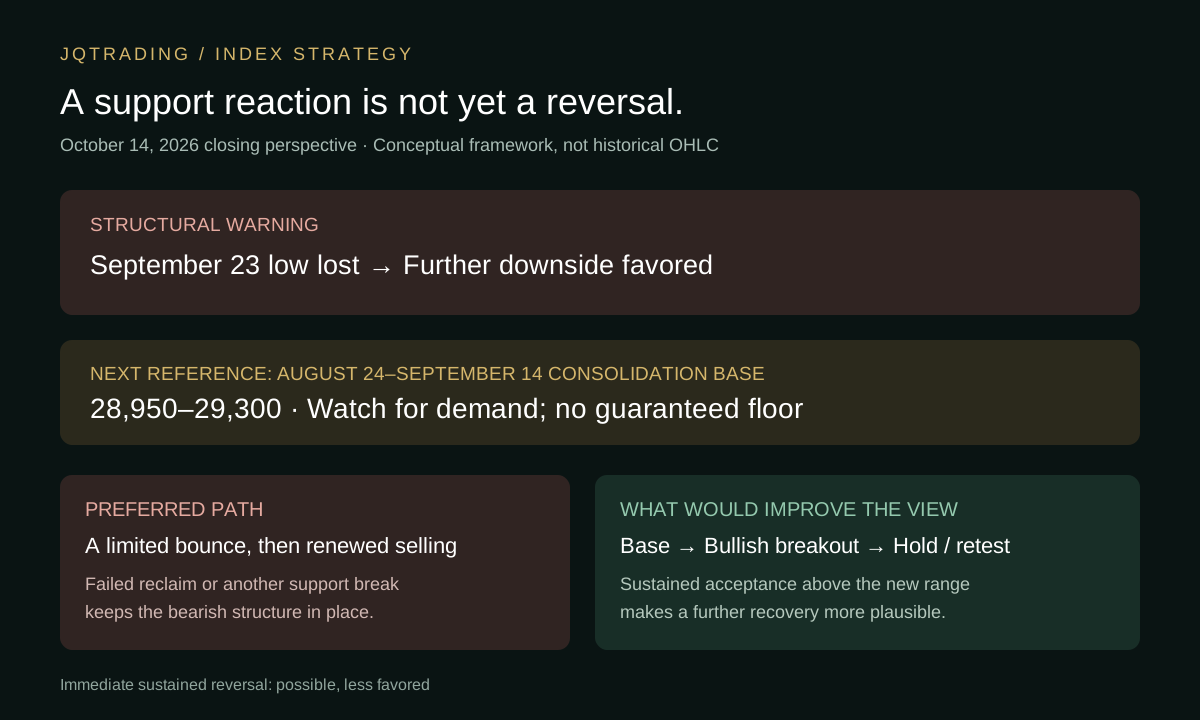
From the October 14 closing perspective, NQ's break below the September 23 low shifts our concern from an ordinary pullback toward the early development of a bearish market structure. We expect further downside, with 28,950–29,300 the first area where we would reassess the selling pressure and the response from buyers.
The lower portion of the August 24–September 14 consolidation is our next reference. Its extended trading history may attract demand, but we do not expect that alone to produce a durable reversal. Our base case is a rebound that struggles to extend, followed by another leg lower unless price establishes and confirms a new base.
Continuity with our earlier view
The failed breakout has become a support failure.
Our earlier failed-breakout outlook focused on the October 6 upper wick near the prior high and October 7's failure to confirm a closing breakout. We favored a correction toward the September 23 low and warned that losing that low would increase the risk of an extended decline.
The October 14 breakdown is consistent with that downside scenario. The market has moved beyond rejection at resistance and lost an important structural reference below. That development strengthens our bearish interpretation, although it does not establish that every part of the earlier framework has been confirmed.
We use “bearish regime” here to describe the developing price structure: failed upside acceptance, lost support and the risk that rebounds form lower highs. We are not claiming that a conventional 20% bear-market threshold has been reached, or that a single breakdown proves a long-term bear market.
Next support area
28,950–29,300 is the first downside reference.
This zone corresponds to the lower portion of the August 24–September 14 consolidation on the analyst's NQ chart. Price spent an extended period trading in that broader range, making its base a logical place to watch for renewed buying interest.
A long consolidation can leave an area that participants continue to recognize. Buyers may respond when price returns, and short covering could contribute to a rebound. But time spent consolidating does not establish how much demand remains. The zone should be treated as a test of support, not a guaranteed floor or evidence that the decline must stop there.
Our initial expectation is that any rebound could be limited. To become more constructive, we would need to see the market hold its recovery, defend reclaimed levels and stop producing fresh lows. A brief rise from support would not be enough to overturn the bearish view.
Two tests at support
A base can change the outlook. Another direct break would worsen it.
The constructive case: NQ reaches the prior consolidation base, stops making persistent new lows and begins to trade sideways. A bullish candle that closes above the upper boundary of that new consolidation would be an initial sign that buyers are regaining control. If subsequent trading holds above the breakout area, or successfully retests it, the case for a more durable recovery would improve.
That distinction matters: a positive candle inside the range is a bounce; a close above the range with sustained acceptance provides stronger evidence of repair. If the recovery can hold, NQ would retain the possibility of continuing higher. We would then reassess the depth and persistence of the bearish structure.
The adverse case: NQ breaks directly through the support zone without establishing a base, repeating the kind of downside failure seen on October 14. A failed attempt to reclaim the zone would make the outlook less favorable and leave room for further declines. We do not assign an additional numerical target before observing how that break develops.
A third path is an immediate, sustained reversal higher without a meaningful base. We consider it possible but less likely than a rebound that eventually fails. That is a qualitative judgment, not a measured probability.
Scenario framework
Separate a tradable reaction from a repaired trend.
| Path | Price behavior to watch | Our interpretation |
|---|---|---|
| Preferred: bounce, then decline | Demand appears near 28,950–29,300, but the rebound stalls beneath resistance and loses support again. | A temporary reaction within an ongoing bearish structure. |
| Constructive repair | NQ consolidates at support, closes above the new range with a bullish candle and holds the breakout area. | Improving structure; a continued advance becomes more plausible. |
| Direct continuation lower | The support zone breaks without a durable base, and a reclaim attempt fails. | Downside pressure remains dominant; further weakness is favored. |
| Less likely: immediate reversal | A sharp recovery quickly reclaims broken structure and holds it without an extended basing period. | Evidence against our preferred path; revise the bearish assessment if sustained. |
What would change our mind
We need evidence that the recovery can hold.
- First sign of repair: repeated defense of the support zone and a clearly defined consolidation, rather than a sequence of fresh lows.
- Stronger confirmation: a bullish close above that consolidation, followed by sustained trading above it or a successful retest.
- Broader improvement: a durable reclaim of the September 23 low would further weaken the breakdown thesis.
- Renewed warning: a failed breakout from the base, a lower high on the rebound or another loss of support would favor further downside.
Our current stance remains bearish. We favor a move toward 28,950–29,300, allow for buying interest there and expect a rebound to be vulnerable. A support hold followed by a confirmed breakout would give us a reason to change that view. Until then, our preferred sequence is a recovery attempt followed by continued decline.
Methodology
Technical framework and risk.
The September 23 support failure, the August 24–September 14 consolidation and the 28,950–29,300 zone are analyst-supplied inputs. No independently verified OHLC series, exact October 14 settlement, measured rebound size or statistical probability is asserted. Use the same NQ contract, roll treatment and session boundaries when comparing these levels.
Related analysis: NQ Fails to Clear Resistance. We Expect a Pullback. Its observation date is October 7; the initial upper-wick signal discussed there is from October 6.
These are conditional technical judgments. Futures involve leverage and substantial risk. This report is research commentary, not individualized investment advice.