
Executive view
Our working count has moved from wave 3 into wave 5.
In our interpretation, the overnight low completed the third downward leg. The strong intraday recovery then formed wave 4, bringing price back toward the October 23 low area around 28,981 before the session ended. We now treat that corrective rebound as complete and favor the start of wave 5.
The speed surprised us. We expected a fourth-wave correction, but not necessarily one that could develop and finish within a single volatile session. This was an unusually forceful reversal sequence in our experience. We expect the next session may also remain volatile, even though our directional preference is firmly bearish.
Our primary wave projection is near 26,424. A deeper probe toward the November 4 MA365 reference near 26,351 is also part of the support-watch scenario. We do not favor a large overshoot below that area as the base case, but neither support nor the wave count guarantees a floor.
Updated reference chart
The fifth-wave line is a projection, not a completed move.
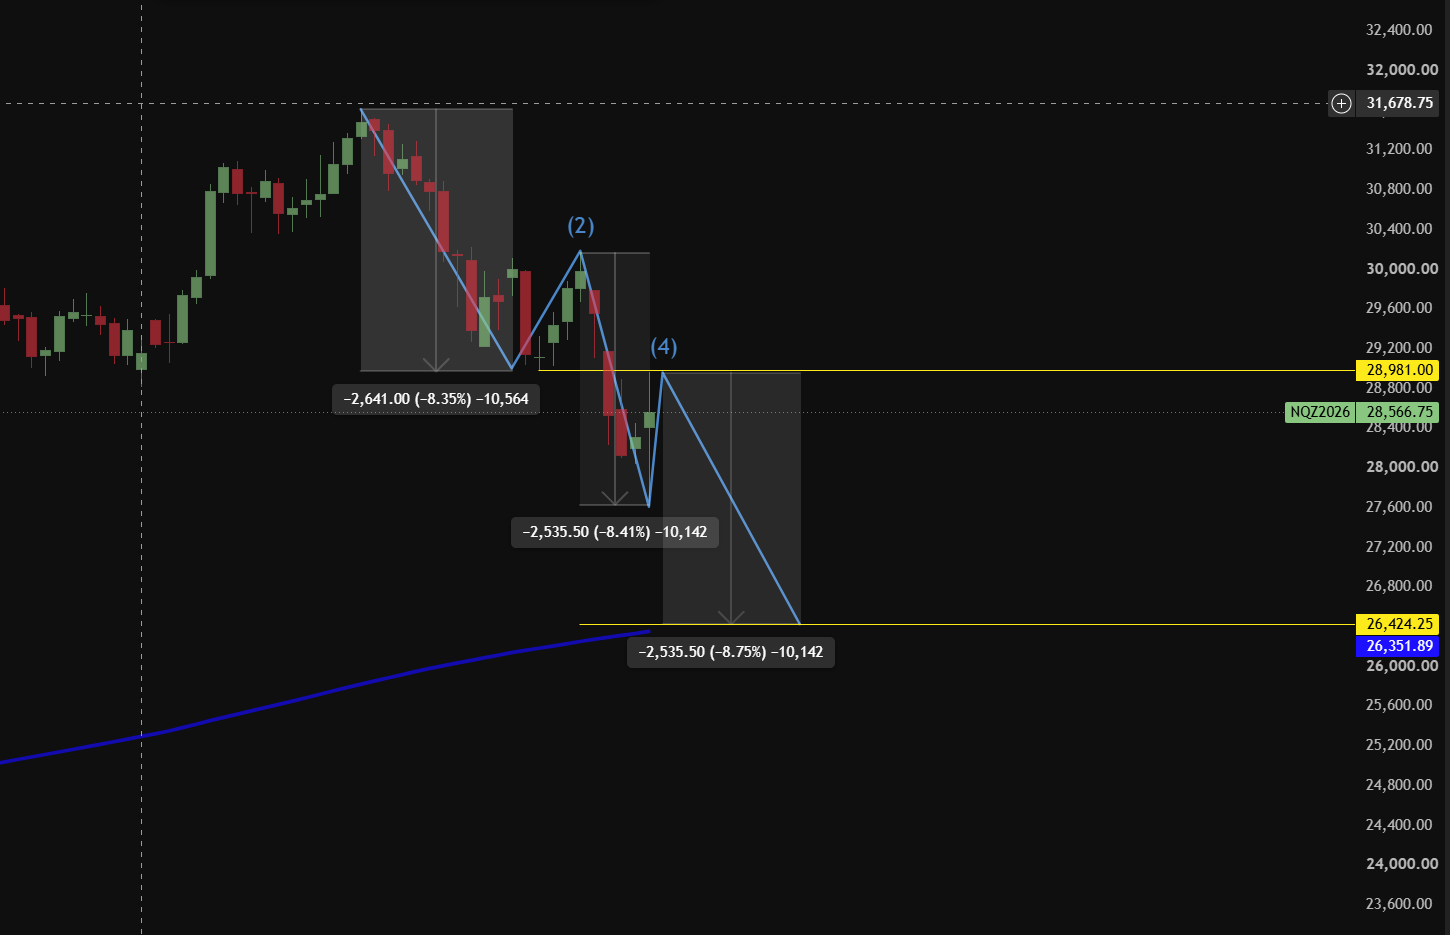
This updates our October 30 five-wave roadmap. At that point, we treated wave 3 as unfinished and left the timing of wave 4 open. We now propose that both turning points have formed. That is an updated count to be tested against price, not a claim that the remaining route is certain.
Wave-length constraint
The third wave came close to the first, but remained shorter.
Our written swing estimate is 2,641 points for wave 1 and approximately 2,567 for wave 3: a difference of 74 points, or about 2.8% of the first leg. The chart uses a slightly different third-wave measurement of 2,535.5. Under either measurement, the third leg is shorter than the first.
The relevant rule is that wave 3 cannot be the shortest of waves 1, 3 and 5. It does not require wave 3 to be the longest. [1] In our point-based count, a shorter third leg means the fifth should be slightly shorter than, or approximately comparable to, wave 3 without becoming the longer leg that leaves wave 3 shortest.
This is why we favor a fifth-wave endpoint near 26,430, with 26,424 the working chart objective, rather than assume an unlimited extension. Near-equality is only a measuring guide. The final fifth-wave length must be checked against the actual fourth-wave high and the same third-wave anchors.
Two nearby downside references
The wave objective and MA365 need separate treatment.
| Reference | Role in our outlook | What to reassess |
|---|---|---|
| 26,424.25 on the chart | Primary fifth-wave projection, near the written 26,424–26,430 objective. | Whether selling is slowing and the five-leg sequence is becoming complete. |
| 26,351.89 on the chart | November 4 MA365 reading; a secondary moving-average support test. | Whether a deeper decline exceeds the permitted fifth-wave length and requires a recount. |
Our combined area of interest runs from approximately 26,424 down toward 26,351. The gap between the two references is about 72 points, broadly the extra 100-point probe we allow for in the moving-average scenario. The MA365 value is a snapshot and will change as new daily observations arrive.
The distinction matters mathematically. Using 28,981 only as an approximate fourth-wave starting reference, a decline to 26,424 is about 2,557 points, while a decline to 26,351 is about 2,630. The first is just shorter than the written 2,567-point third leg; the second is longer. The plotted third-wave measurement is smaller still. A full MA365 test therefore cannot automatically be described as satisfying the same strict fifth-wave length constraint. We would need to reconcile the actual swing anchors or revise the count.
We still regard a rebound from this combined support area as a plausible next phase. That expectation comes from the completion-and-support scenario, not from a guarantee that every price in the area validates the original wave model.
Next-session stance and invalidation
We favor selling pressure, with today's high as the decisive test.
Our personal expectation is that the next session moves lower and does not finish above the November 4 intraday peak. From this post-close perspective, we view strength below that peak as a potential short-side setup within the proposed fifth-wave scenario. The volatility also means a position can be challenged sharply before any forecast is resolved.
Our conviction is strong, but we do not assign a literal zero probability to an advance. The test is explicit: if NQ trades above the actual November 4 intraday high, our claim that wave 4 has already ended and wave 5 is underway fails. This is a test of the actual session high, not an assumption that the nearby 28,981 reference is its exact value.
A new high would require us to reconsider an extended correction, a trading range or a more constructive recovery. It would not automatically prove which alternative will follow. We would step back and update the structure rather than continue presenting the same fifth-wave target as confirmed.
After five waves
Our next working phase is an A–B–C recovery.
A simple Elliott cycle combines a five-wave motive move with a corrective phase labeled A, B and C. Following a downward five-wave sequence, our simplified recovery roadmap is an upward A wave, a downward B retracement and a further upward C leg. Corrective patterns can be more complicated than this outline. [2]
We would begin looking for that transition if the fifth leg approaches its objective and selling starts to lose momentum. A sustained rebound, an emerging higher low and a break of the decline's short-term structure would be more useful evidence than simply touching a projected number.
We are not setting A, B or C targets now. First, the fifth-wave endpoint must become identifiable. Even a convincing A-wave rebound would initially be a recovery from the decline, rather than automatic evidence that the larger trend has permanently turned bullish.
Our conclusion
Bearish into the fifth leg; ready to reassess at support.
As of November 4 after the close, we treat wave 4 as complete and expect wave 5 to carry price toward 26,424. A probe toward the MA365 area around 26,351 remains a secondary scenario, with the important consequence that an excessive fifth-wave length would require a recount. We then expect to evaluate an ABC rebound rather than extrapolate the decline indefinitely.
The speed of today's correction reinforces our expectation of continued volatility. It does not make tomorrow certain. Our outlook remains a forecast with a clear failure condition: a move above today's intraday high invalidates this immediate count.
Sources and methodology
- Elliott Wave International: Motive Waves. Directional-wave length rule.
- Elliott Wave International: Corrective Waves. ABC framework and corrective-pattern variations.
This analysis uses the November 4, 2026 post-close perspective and the analyst's supplied chart and measurements. The 2,567-point written estimate and 2,535.5-point chart measurement are not treated as identical. The earlier close-based overlap adaptation remains an author-defined filter; this report does not assert a fully verified textbook impulse count. Use consistent NQ contracts, session boundaries, swing anchors and moving-average settings. Futures involve leverage and substantial risk.